
Reducing Deviation Resolution Time in Pharmaceutical Quality Assurance
- Problem Statement: Resolving deviation reports in a pharmaceutical QA department typically takes 20 days. Extended periods for resolving deviations may result in production setbacks, increased expenses, and other compliance hazards. With a 10-day turnaround time in mind, the objective is to cut the average resolution time by 50%.
- 1. Define PhaseObjectives:
- Cut the average time needed to resolve deviations from 20 to 10 days.
- Determine the underlying factors causing delays.
- To increase efficiency and streamline the process, apply Lean Six Sigma techniques.
- Key Metrics:
- 20 days is the baseline average deviation resolution time.
- Ten days is the target average resolution time.
- Stakeholders:
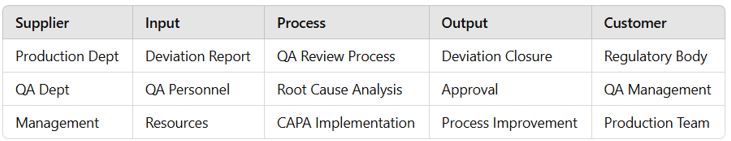
- QA team, production team, compliance department, and senior management. SIOPC Diagram:(Supplier, Input, Process, Output, Customer)
- 2. Measure Phase Data Collection:Collect data on deviation closure times over the last six months. Key data points include:
- Deviation type (e.g., equipment, process, human error).
- Number of days for each deviation from report initiation to closure.
- Key bottlenecks (e.g., review delays, root cause analysis time).
- A histogram helps visualize the distribution of closure times, showing the extent of variation.
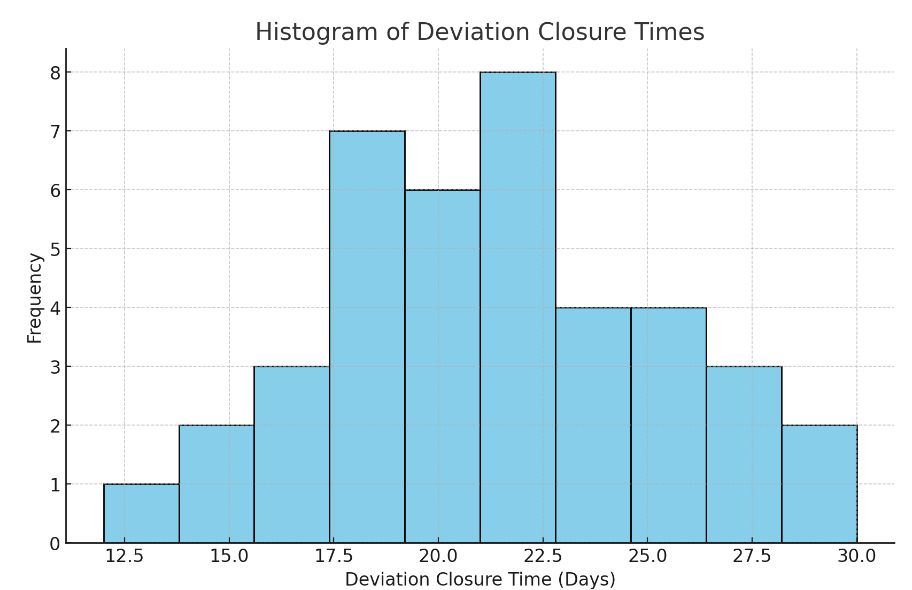
- Here is the histogram of deviation closure times. This visual shows the distribution of deviation resolution times, helping to identify the frequency of various closure durations and any patterns or clusters. This data will be useful for pinpointing typical delays and setting more accurate targets in the improvement phase. Let me know if you'd like to adjust any details or add further analysis.
- Current State Process Map:A flowchart illustrating the current deviation resolution process helps identify where the delays occur.
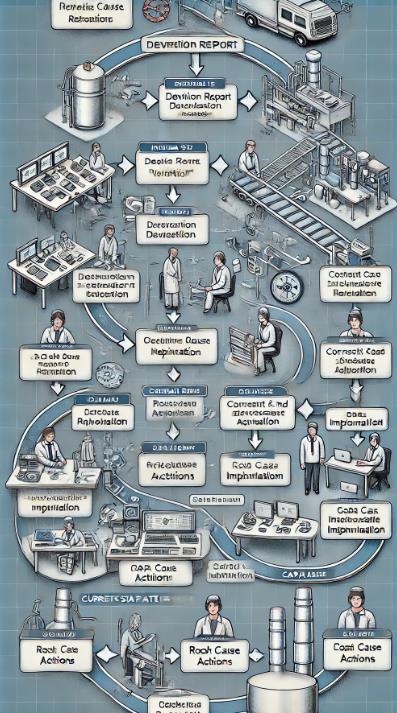
- The QA department's deviation resolution procedure is shown in this Current State Process Map flowchart, which highlights each phase and any bottlenecks. This illustration need to provide a concise synopsis of the procedure and possible enhancement areas. If you would like to look into any further details, please let me know.
- 3. Analyze PhaseRoot Cause Analysis:Determine the underlying causes of extended deviation using the Fishbone (Ishikawa) Diagram and the Five Whys. Typical problems could be:
- Employees: Insufficient root cause analysis training and a shortage of a QA personnel.
- Procedure: Difficult approval process that involves several reviews and delays in the implementation of CAPA.
- Technology: Inadequate automation and manual entry mistakes in documents.
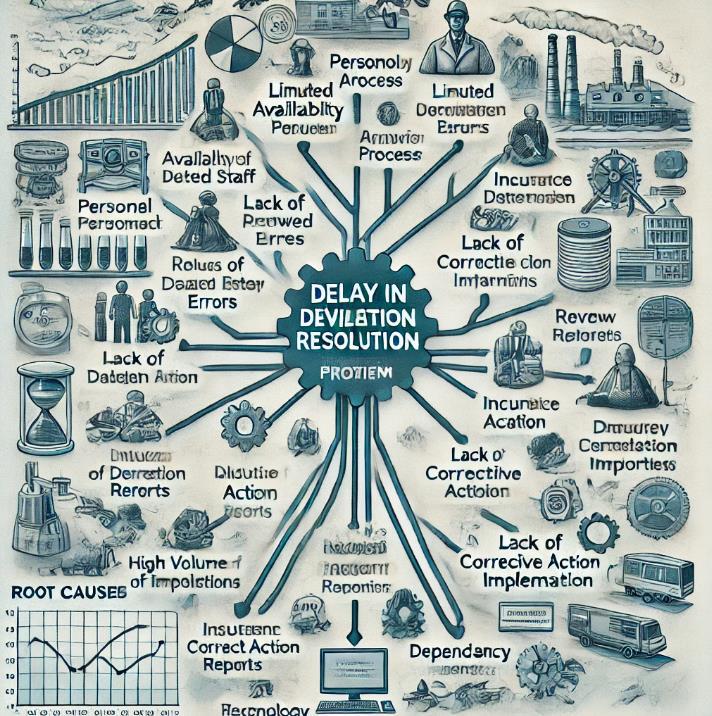
- This is the Fishbone Diagram (Ishikawa Diagram), which is used to examine the underlying reasons why the QA department's deviation resolution timeframes are delayed. Key contributing elements are captured by each branch, offering an organized perspective of the areas that need attention during the improvement phase. If you would like further information on any particular section, please let me know!
- Pareto Analysis:Identify which deviation types contribute most to prolonged resolution times using Pareto charts
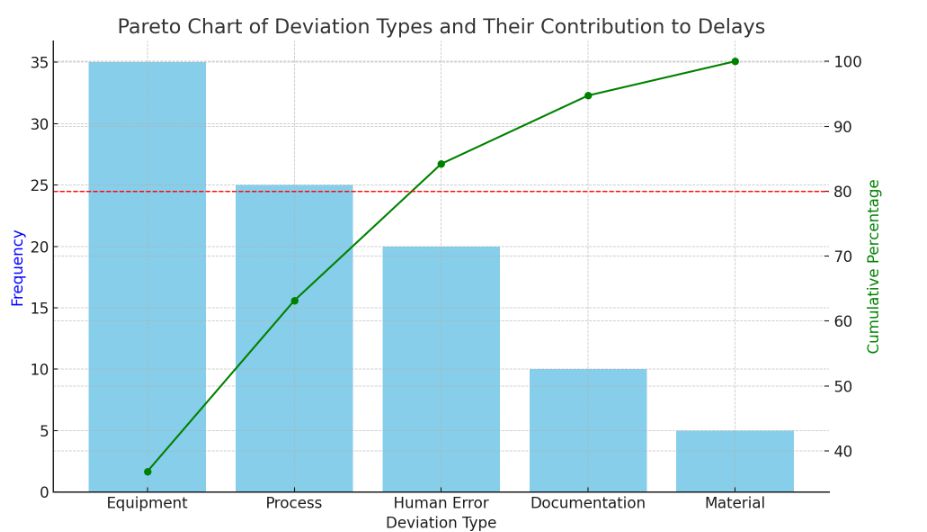
- This Pareto chart shows the many kinds of deviations and how they affect the time it takes to resolve issues. With the key deviation categories accounting for 80% of delays, the cumulative percentage line identifies the top contributors and enables the QA team to target areas of focus for improvement.
- 4.Improve Phase
-
Brainstorm Solutions:
Based on root cause analysis, develop possible solutions for each category: - Standardize Deviation Reporting: Implement a structured template for deviations to ensure consistency.
- Streamline Approvals: Reduce redundant approvals; assign specific approvers for routine deviations.
- Automate Documentation: Use software to digitize and automate deviation reporting and tracking.
- Training and Capacity Building: Conduct targeted training to reduce time in root cause analysis.
- Solution Prioritization Matrix: Prioritize options using a matrix according to their viability and impact.
- 5. Control Phase
- Implement Controls:It is recommended that Standard Operating Procedures (SOPs) be updated to incorporate simplified processes.
- Visual Management Tools: Monitor the status of deviations in real time with digital dashboards.
- Training Sessions: Consistent instruction on the recently implemented deviation procedure.
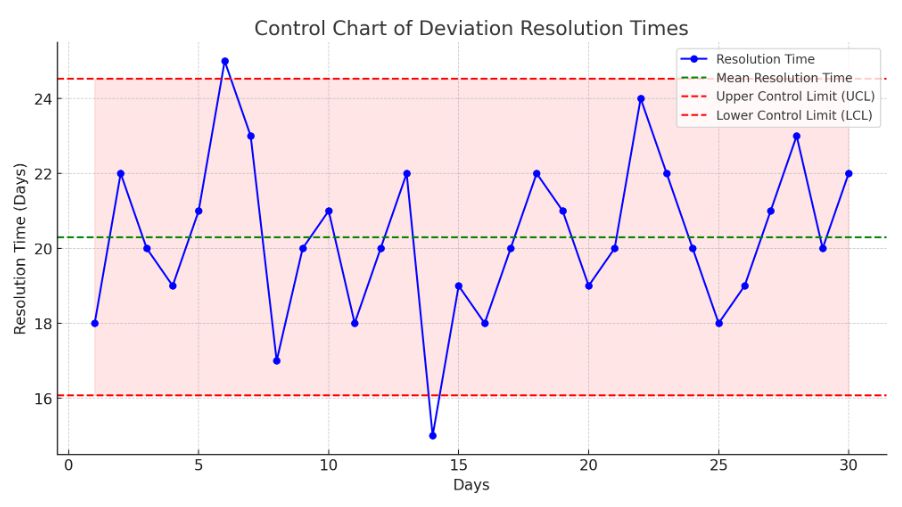
- This is the control chart that shows the 30-day deviation resolution timeframes. Together with higher and lower control limits, the mean resolution time is displayed to represent the range of expected resolution times. Any out-of-control points or trends that might require remedial action can be found using this chart.
- KPI Monitoring:Set KPIs for deviation resolution times, and track performance monthly.
- Future State Process Map:
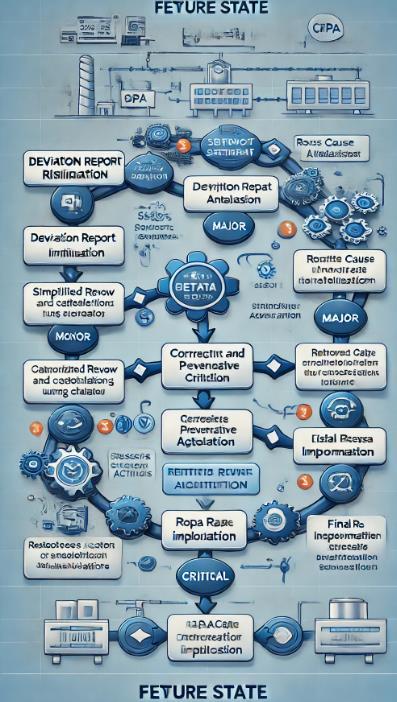
- This Future State Process Map illustrates how the Lean Six Sigma enhancements led to a more efficient deviation resolution procedure. In keeping with the project's objectives for greater efficiency, this map shows the streamlined processes, fewer bottlenecks, and quicker resolution times. If there is anything special you would like to add or change on the map, please let me know!
- Results and Analysis: Improvement Calculation:
- Initial Average Deviation Resolution Time (µ_initial): 20 days
- Target Average Resolution Time (µ_target): 10 days
- Percentage Improvement Calculation:
- The percentage improvement in deviation resolution time can be calculated as follows
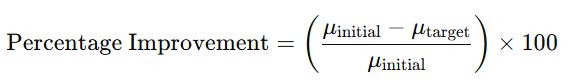
- Where?
- μinitial = Initial average resolution time = 20 days
- μtarget = Target average resolution time = 10 day
- Substitute the values,
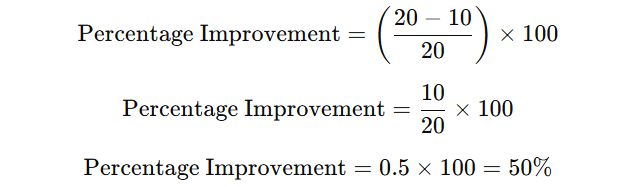
- So, the improvement goal is a 50% reduction in deviation resolution time. Cost-Benefit Analysis: Calculate potential cost savings based on reduction in deviation times, e.g., production downtime savings, manpower savings, and avoided compliance risks.